Publications
Authers:by Ate Poortinga, Aekkapol Aekakkararungroj 2,Kritsana Kityuttachai, Quyen Nguyen, Biplov Bhandari, Nyein Soe Thwal, Hannah Priestley, Jiwon Kim, Karis Tenneson, Farrukh Chishtie, Peeranan Towashiraporn, David Saah
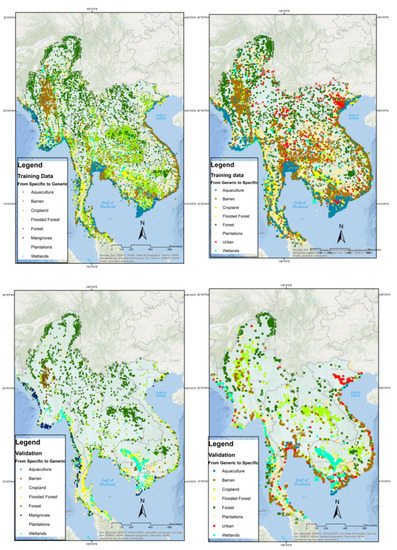
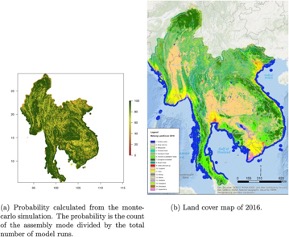
Understanding land cover change dynamics and potential pathways of change is of critical importance for sustainable resource management, to promote food security and resilience on a range of spatial scales. Data scarcity is a key concern, however, with the availability of free Earth Observation (EO) data, such challenges can be suitably addressed. In this research we have developed a robust machine learning (random forest) approach utilizing EO and Geographic Information System (GIS) data, which enables an innovative means for our simulations to be driven only by historical drivers of change and hotspot prediction based on probability to change. We used the South East Asia as a case study to generate a training and validation sample from historical land cover patterns of change and used this information to train a random forest machine learning model. Data samples were created from the SERVIR-SEA land cover data series. Data sets were created for 2 categories both containing 8 classes. The 2 categories included—any generic class to change into a specific one and vice versa. Classes included the following: Aquaculture; Barren; Cropland; Flooded Forest; Mangroves; Forest; Plantations; Wetlands; and Urban. The training points were used to sample a series of satellite-derived surface reflectance products and other data layers such as information on slope, distance to road and census data, which represent the drivers of change. The classifier was trained in binary mode and showed a clear separation between change and no change. An independent validation dataset of historical change pixels show that all median change probabilities are greater than 80% and all lower quantiles, except one, are greater than 70%. The 2018 probability change maps show high probabilities for the Plantations and Forest classes in the ‘Generic to Specific’ and ’Specific to generic’ category, respectively. A time-series analysis of change probability shows that forests have become more likely to convert into other classes during the last two decades, across all countries. We successfully demonstrated that historical change patters combined with big data and machine learning technologies are powerful tools for predictive change analytics on a planetary scale.
Authers: David Saah, Karis Tenneson, Ate Poortinga, Quyen Nguyen, Farrukh Chishtie, Khun San Aung
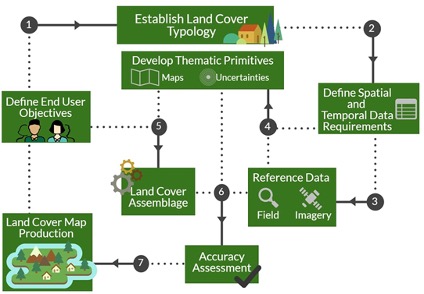
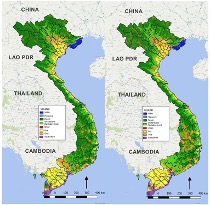
Land cover maps play an integral role in environmental management. However, countries and institutes encounter many challenges with producing timely, efficient, and temporally harmonized updates to their land cover maps. To address these issues we present a modular Regional Land Cover Monitoring System (RLCMS) architecture that is easily customized to create land cover products using primitive map layers. Primitive map layers are a suite of biophysical and end member maps, with land cover primitives representing the raw information needed to make decisions in a dichotomous key for land cover classification. We present best practices to create and assemble primitives from optical satellite using computing technologies, decision tree logic and Monte Carlo simulations to integrate their uncertainties. The concept is presented in the context of a regional land cover map based on a shared regional typology with 18 land cover classes agreed on by stakeholders from Cambodia, Laos PDR, Myanmar, Thailand, and Vietnam. We created annual map and uncertainty layers for the period 2000–2017. We found an overall accuracy of 94% when taking uncertainties into account. RLCMS produces consistent time series products using free long term historical Landsat and MODIS data. The customizable architecture can include a variety of sensors and machine learning algorithms to create primitives and the best suited smoothing can be applied on a primitive level. The system is transferable to all regions around the globe because of its use of publicly available global data (Landsat and MODIS) and easily adaptable architecture that allows for the incorporation of a customizable assembly logic to map different land cover typologies based on the user's landscape monitoring objectives
Authers: David Saah, Karis Tenneson, Mir Matin, Kabir Uddin, Peter Cutter, Ate Poortinga
Land cover maps are a critical component to make informed policy, development, planning, and resource management decisions. However, technical, capacity, and institutional challenges inhibit the creation of consistent and relevant land cover maps for use in developing regions. Many developing regions lack coordinated capacity, infrastructure, and technologies to produce a robust land cover monitoring system that meets land management needs. Local capacity may be replaced by external consultants or methods which lack long-term sustainability. In this study, we characterize and respond to the key land cover mapping gaps and challenges encountered in the South East Asia (SEA) and Hindu Kush-Himalaya (HKH) region through a needs assessment exercise and a collaborative system design. Needs were assessed using multiple approaches, including focus groups, user engagement workshops, and online surveys. Efforts to understand existing limitations and stakeholder needs resulted in a co-developed and modular land cover monitoring system which utilizes state-of-the-art cloud computing and machine learning which leverages freely available Earth observations. This approach meets the needs of diverse actors and is a model for transnational cooperation.
Authers: P.Potapov, A. Tyukavina, S. Turubanova, Y. Talero, A. Hernandez-Serna
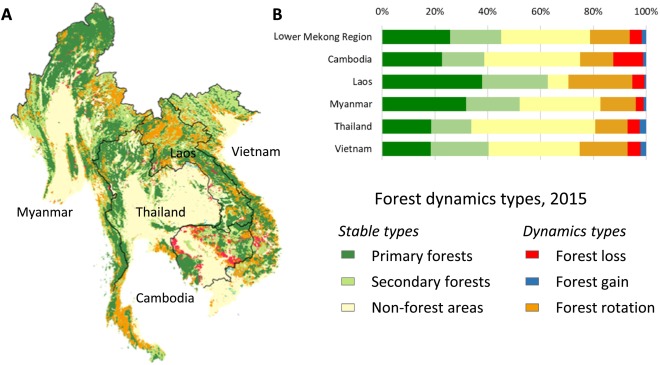
Spatially and temporally consistent vegetation structure time-series have great potential to improve the capacity for national land cover monitoring, to reduce latency and cost of international reporting, and to harmonize regional land cover characterizations. Here we present a semi-automatic, operational algorithm for mapping and monitoring of woody vegetation canopy cover and height at a regional scale using freely available Landsat time-series data. The presented algorithm employs automatic data processing and mapping using a set of lidar-based vegetation structure prediction models. Changes in vegetation cover are detected separately and integrated into the structure time-series. Sample-based validation and inter-comparison with existing datasets demonstrates the spatial and temporal consistency of our regional data time-series. The dataset reliably reflects changes in tree cover (tree cover loss user's accuracy of 0.84 and producer's accuracy of 0.75) and can serve as a tool to map annual forest extent (user's accuracy of 0.98 and producer's accuracy of 0.81 for 10% canopy cover threshold to define the forest class). The tree height estimates are consistent with a GLAS-based global map (mean average error of 3.7 m, the correlation coefficient of 0.92 and the R2 of 0.85). The algorithm was prototyped within the South East Asia where it revealed an intensive woody vegetation dynamic. Of the year 2000 forest area (defined using canopy cover threshold of 10% and tree height threshold of 5 m), 9.4% was deforested by the year 2017, and 16.6% was affected by stand-replacement disturbance followed by reforestation. The average annual area of stand-level forest disturbance within the region was 2.34 Mha, and increased by 34% from 2001 (1.85 Mha) to 2017 (2.48 Mha). Total forest area decreased by 6.2% within the region, and 11.1% of year 2000 primary forest area was lost by 2017. At the national level, Cambodia demonstrated the highest rate of deforestation, with a net forest area loss of 22.5%. We estimated that 21.3% of 2017 forest cover had an age of 17 years or less, illustrating the intensive forest land uses within the region. The time-series product is suitable for mapping annual land cover and inter-annual land cover change using customized class definitions.
Authers: Ate Poortinga, Quyen Nguyen, Karis Tenneson, Austin Troy, David Saah, Biplov Bhandari
Land cover change and its impact on food security is a topic that has major implications for development in population-dense Southeast Asia. The main drivers of forest loss include the expansion of agriculture and plantation estates, growth of urban centers, extraction of natural resources, and water infrastructure development. The design and implementation of appropriate land use policies requires accurate and timely information on land cover dynamics to account for potential political, economical, and agricultural consequences. Therefore, SERVIR-SEA led the collaborative development of a Regional Land Cover Monitoring System (RLCMS) with key regional stakeholders across the South East Asia. Through this effort, a modular system was used to create yearly land cover maps for the period 1988–2017. In this study, we compared this 30-year land cover time-series with Vietnam national forest resources and agricultural productivity statistics. We used remote sensing-derived land cover products to quantify landscape changes and linked those with food availability, one of food security dimension, from a landscape approach perspective. We found that agricultural production has soared while the coverage of agricultural areas has remained relatively stable. Land cover change dynamics coincide with important legislation regarding environmental management and sustainable development strategies in Vietnam. Our findings indicate that Vietnam has made major steps toward improving its' food security. We demonstrate that RLCMS is a valuable tool for evaluating the relationship between policies and their impacts on food security, ecosystem services and natural capital.
Authers: Ate Poortinga, Karis Tenneson, Aurélie Shapiro, Quyen Nquyen, Khun San Aung, Farrukh Chishtie and David Saah
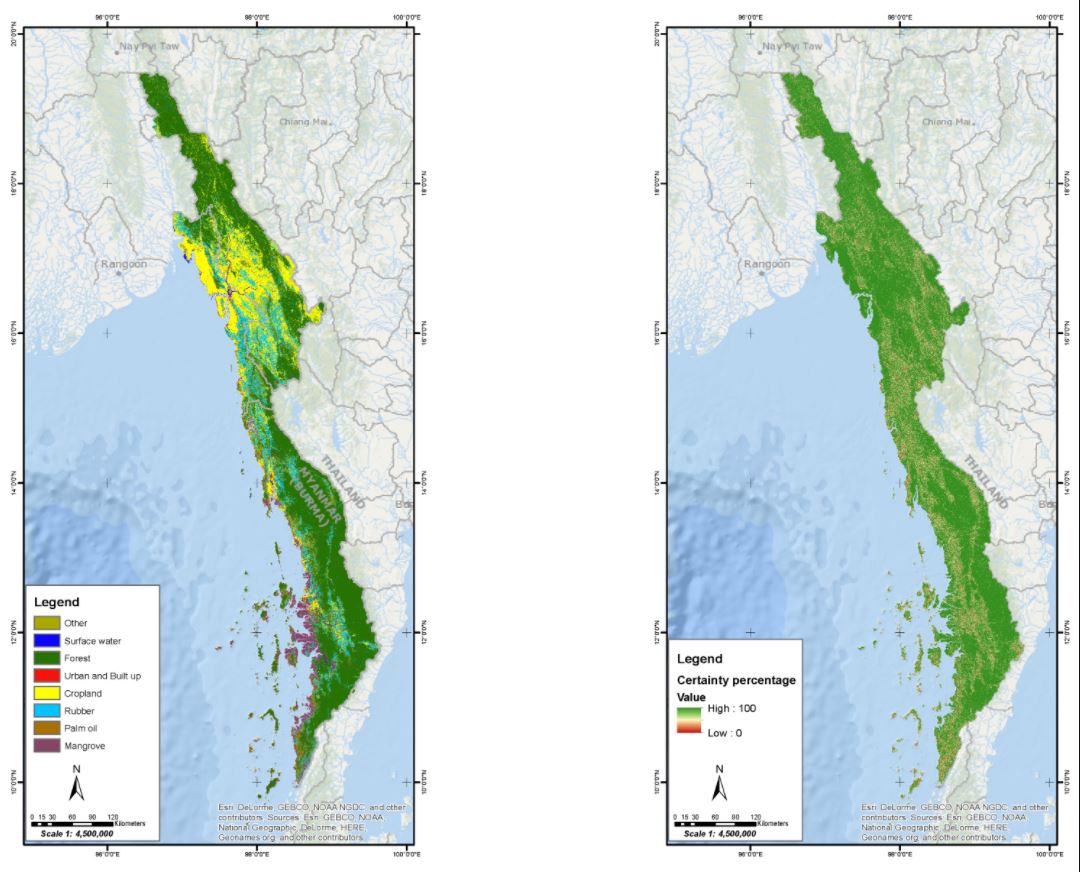
Forests in Southeast Asia are experiencing some of the highest rates of deforestation and degradation in the world, with natural forest species being replaced by cropland and plantation monoculture. In this work, we have developed an innovative method to accurately map rubber and palm oil plantations using fusion of Landsat-8, Sentinel 1 and 2. We applied cloud and shadow masking, bidirectional reflectance distribution function (BRDF), atmospheric and topographic corrections to the optical imagery and a speckle filter and harmonics for Synthetic Aperture Radar (SAR) data. In this workflow, we created yearly composites for all sensors and combined the data into a single composite. A series of covariates were calculated from optical bands and sampled using reference data of the land cover classes including surface water, forest, urban and built-up, cropland, rubber, palm oil and mangrove. This training dataset was used to create biophysical probability layers (primitives) for each class. These primitives were then used to create land cover and probability maps in a decision tree logic and Monte-Carlo simulations. Validation showed good overall accuracy (84%) for the years 2017 and 2018. Filtering for validation points with high error estimates improved the accuracy up to 91%. We demonstrated and concluded that error quantification is an essential step in land cover classification and land cover change detection. Our overall analysis supports and presents a path for improving present assessments for sustainable supply chain analyses and associated recommendations.
Authers: David Saah, Gary Johnson, Billy Ashmall, Githika Tondapu, Karis Tenneson
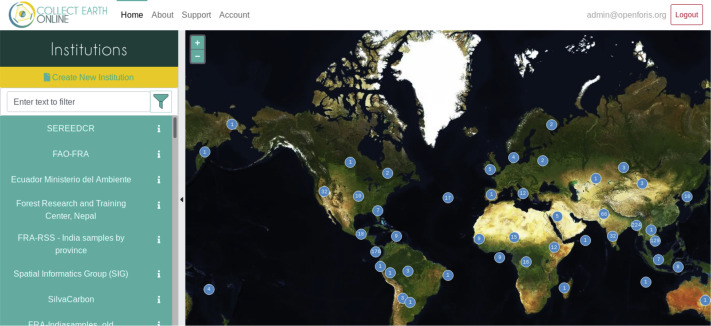
Land cover monitoring efforts are important for resource planning and ecosystem services in many countries. Collect Earth Online (CEO) is a new, free open source and user-friendly software tool for land monitoring. It is the product of a collaborative effort between NASA, Food and Agriculture Organization of the United Nations (FAO), US Forest Service and Google. This paper provides a full overview of CEO's structure and functionality. Based on the cloud, CEO's structure supports simultaneous data entry by multiple users. No desktop installation is required and only an internet connection is required setting minimal requirements for using the software. Google Earth Engine widgets can be created for assisted plot interpretation such as image collection, time series graphs featuring indices such as Normalized Difference Vegetation Index (NDVI) and related statistics. We also provide a case study and related findings from a CEO workshop held in Myanmar.